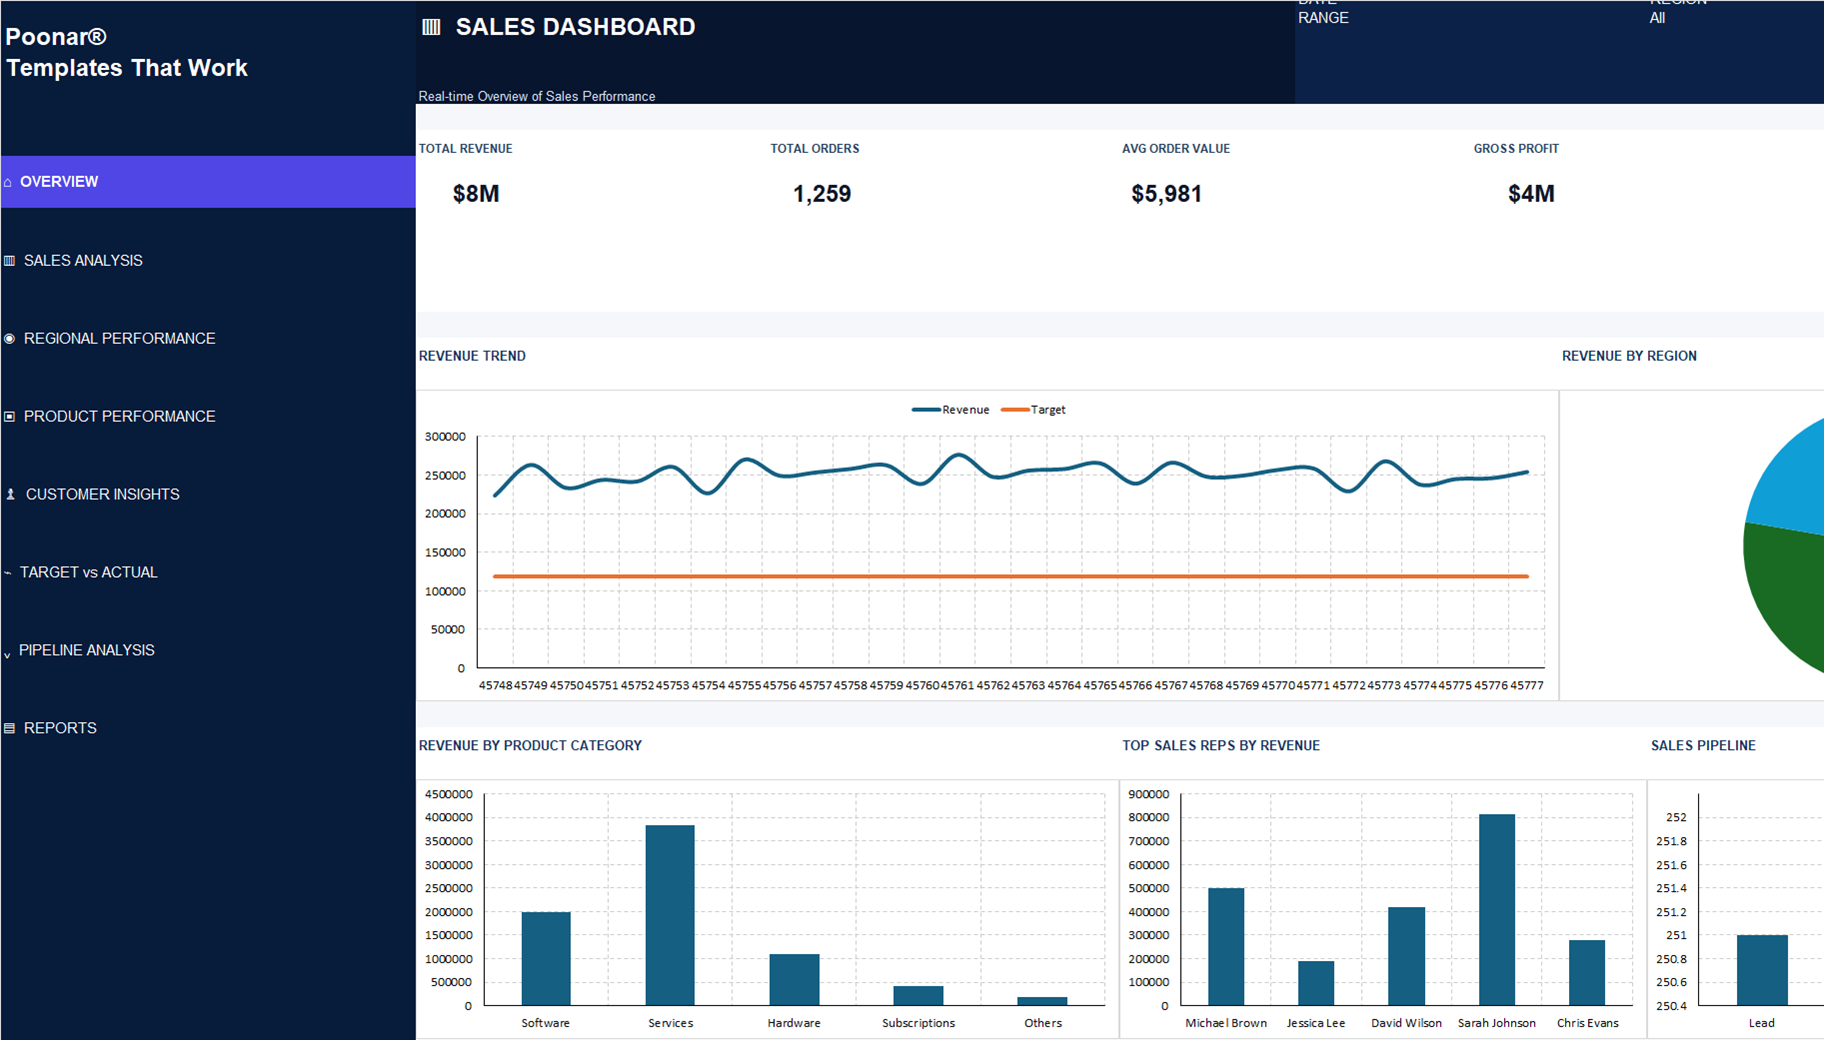
Screenshots show the real product preview. Paid source files remain private until entitlement is verified.
What it does
A full sales command centre: revenue trend against target, pipeline by stage, a rep leaderboard, and revenue broken down by product and region — all recalculating from a single data-entry sheet.
Who it is for
Sales managers and small teams who want one sheet instead of five disconnected reports.
Problems it solves
Replaces a manual weekly sales report with a workbook that updates itself as new orders and reps are logged.
Features
- Rep leaderboard by revenue
- Pipeline analysis by stage
- Revenue vs. target trend
- Revenue by product category and region
- Editable products, reps and targets lists
What is included
Dashboard, Data Input, Products, Customers, Sales Reps, Targets, Settings, Lists
How it works
Log each sale in Data Input against a product, rep and customer. The Dashboard sheet recalculates every chart and KPI automatically.